Introduction
Memory analysis (sometimes called memory forensics) is a key part of Digital Forensics and Incident Response (DFIR) process for analyzing malware and exploits, but also for troubleshooting issues. If something can’t be found on disk, you’ll find it in memory because memory provides an exact state of a machine or device at a specific time.
Memory capture and analysis is an important step of DFIR before rebooting a machine or device because implants may not be persistent, as mentioned recently by Sen. Angus King.
Despite being a critical step, it’s often left out due to poor user experience, the required operating system internals knowledge, and reliance on manual operations because of the lack of automation.
This post presents important changes and new features that were implemented in Comae platform V2.0 Beta over the past year.
Moving to a New Cloud Provider
Previously, we were hosted on Azure. We’ve now moved to AWS and are cloud-agnostic, which required us to re-architecture the platform. One of the main reasons for choosing AWS was the AWS Marketplace, where we are planning to have the Comae platform available as a PaaS offering, in addition to a purely SaaS offering like we initially designed it. This will allow customers to deploy with ease and have more control over data collection, processing, and governance. But it will also help with procurement and billing requirements as that would be handled directly by AWS Marketplace.
Memory Analysis in Rust
The tools we use to analyze memory have been all rewritten from C++ to Rust. Rewriting software is a time-consuming process, but here’s why we think it was worth it for us.
With Rust, there is more confidence and control in the data processing because the language comes with great features for writing correct code: an expressive type system, the borrow checker, and so on. More importantly, you don’t really have to think about this, it happens naturally due to the way the language is designed. Once you’re comfortable with Rust, this doesn’t get in the way of writing code. Thanks to zero-cost abstractions and no GC, you don’t pay a performance penalty for this either. The ecosystem has many high-quality libraries and tools unlike other programming languages.
Rust also allows us to be platform-agnostic, which means more flexibility when it comes to packaging it as a web service, a serverless function, or a standalone command-line tool, for easy integration with customers and partners.
A Redesigned User Interface and Backend
The two main focus areas of this new version were:
- A redesigned user experience with a strong emphasis on collaboration.
- Better navigation and querying of data.
The new user experience offers a more insightful interface and also provides collaboration features (such as sharing and classification) for users who are part of a same organization or projects.
Data navigation and querying through the new user interface have also been a strong focus due to their importance for threat-hunting. Users can now search for IOCs within a snapshot, but also across multiple snapshots, machines, or projects.
A Structure-Aware Query Language for Memory and Playbooks
Data in memory is organized in a certain way. If we know the layout, we can analyze it. That’s exactly what our platform does.
Predefined queries limit the number of options available for analysis while the regex approach is often too slow or returns many false positives.
The new version of the platform introduces a way of searching memory through
structure-aware queries. You can look at various top-level objects (processes,
drivers, syscalls, etc.) and their sub-objects, combine queries using logic
operators (&&, ||), and filter out results to only show the fields you’re
interested in. The design goals of this language were to be generic and easy to
use.
Here’s an example query:
process
.Where(
    process.process_object.parent_process_id == 1 &&
    process.vad_object.file_name == "/usr/sbin/agetty"
)
.Select([
    process.handle_object.name,
    process.process_object.directory_table_base,
    process.process_object.process_id,
    process.vad_object.file_name,
])
This will go through all processes in the system and only return those matching
the Where clause and only the fields listed in Select.
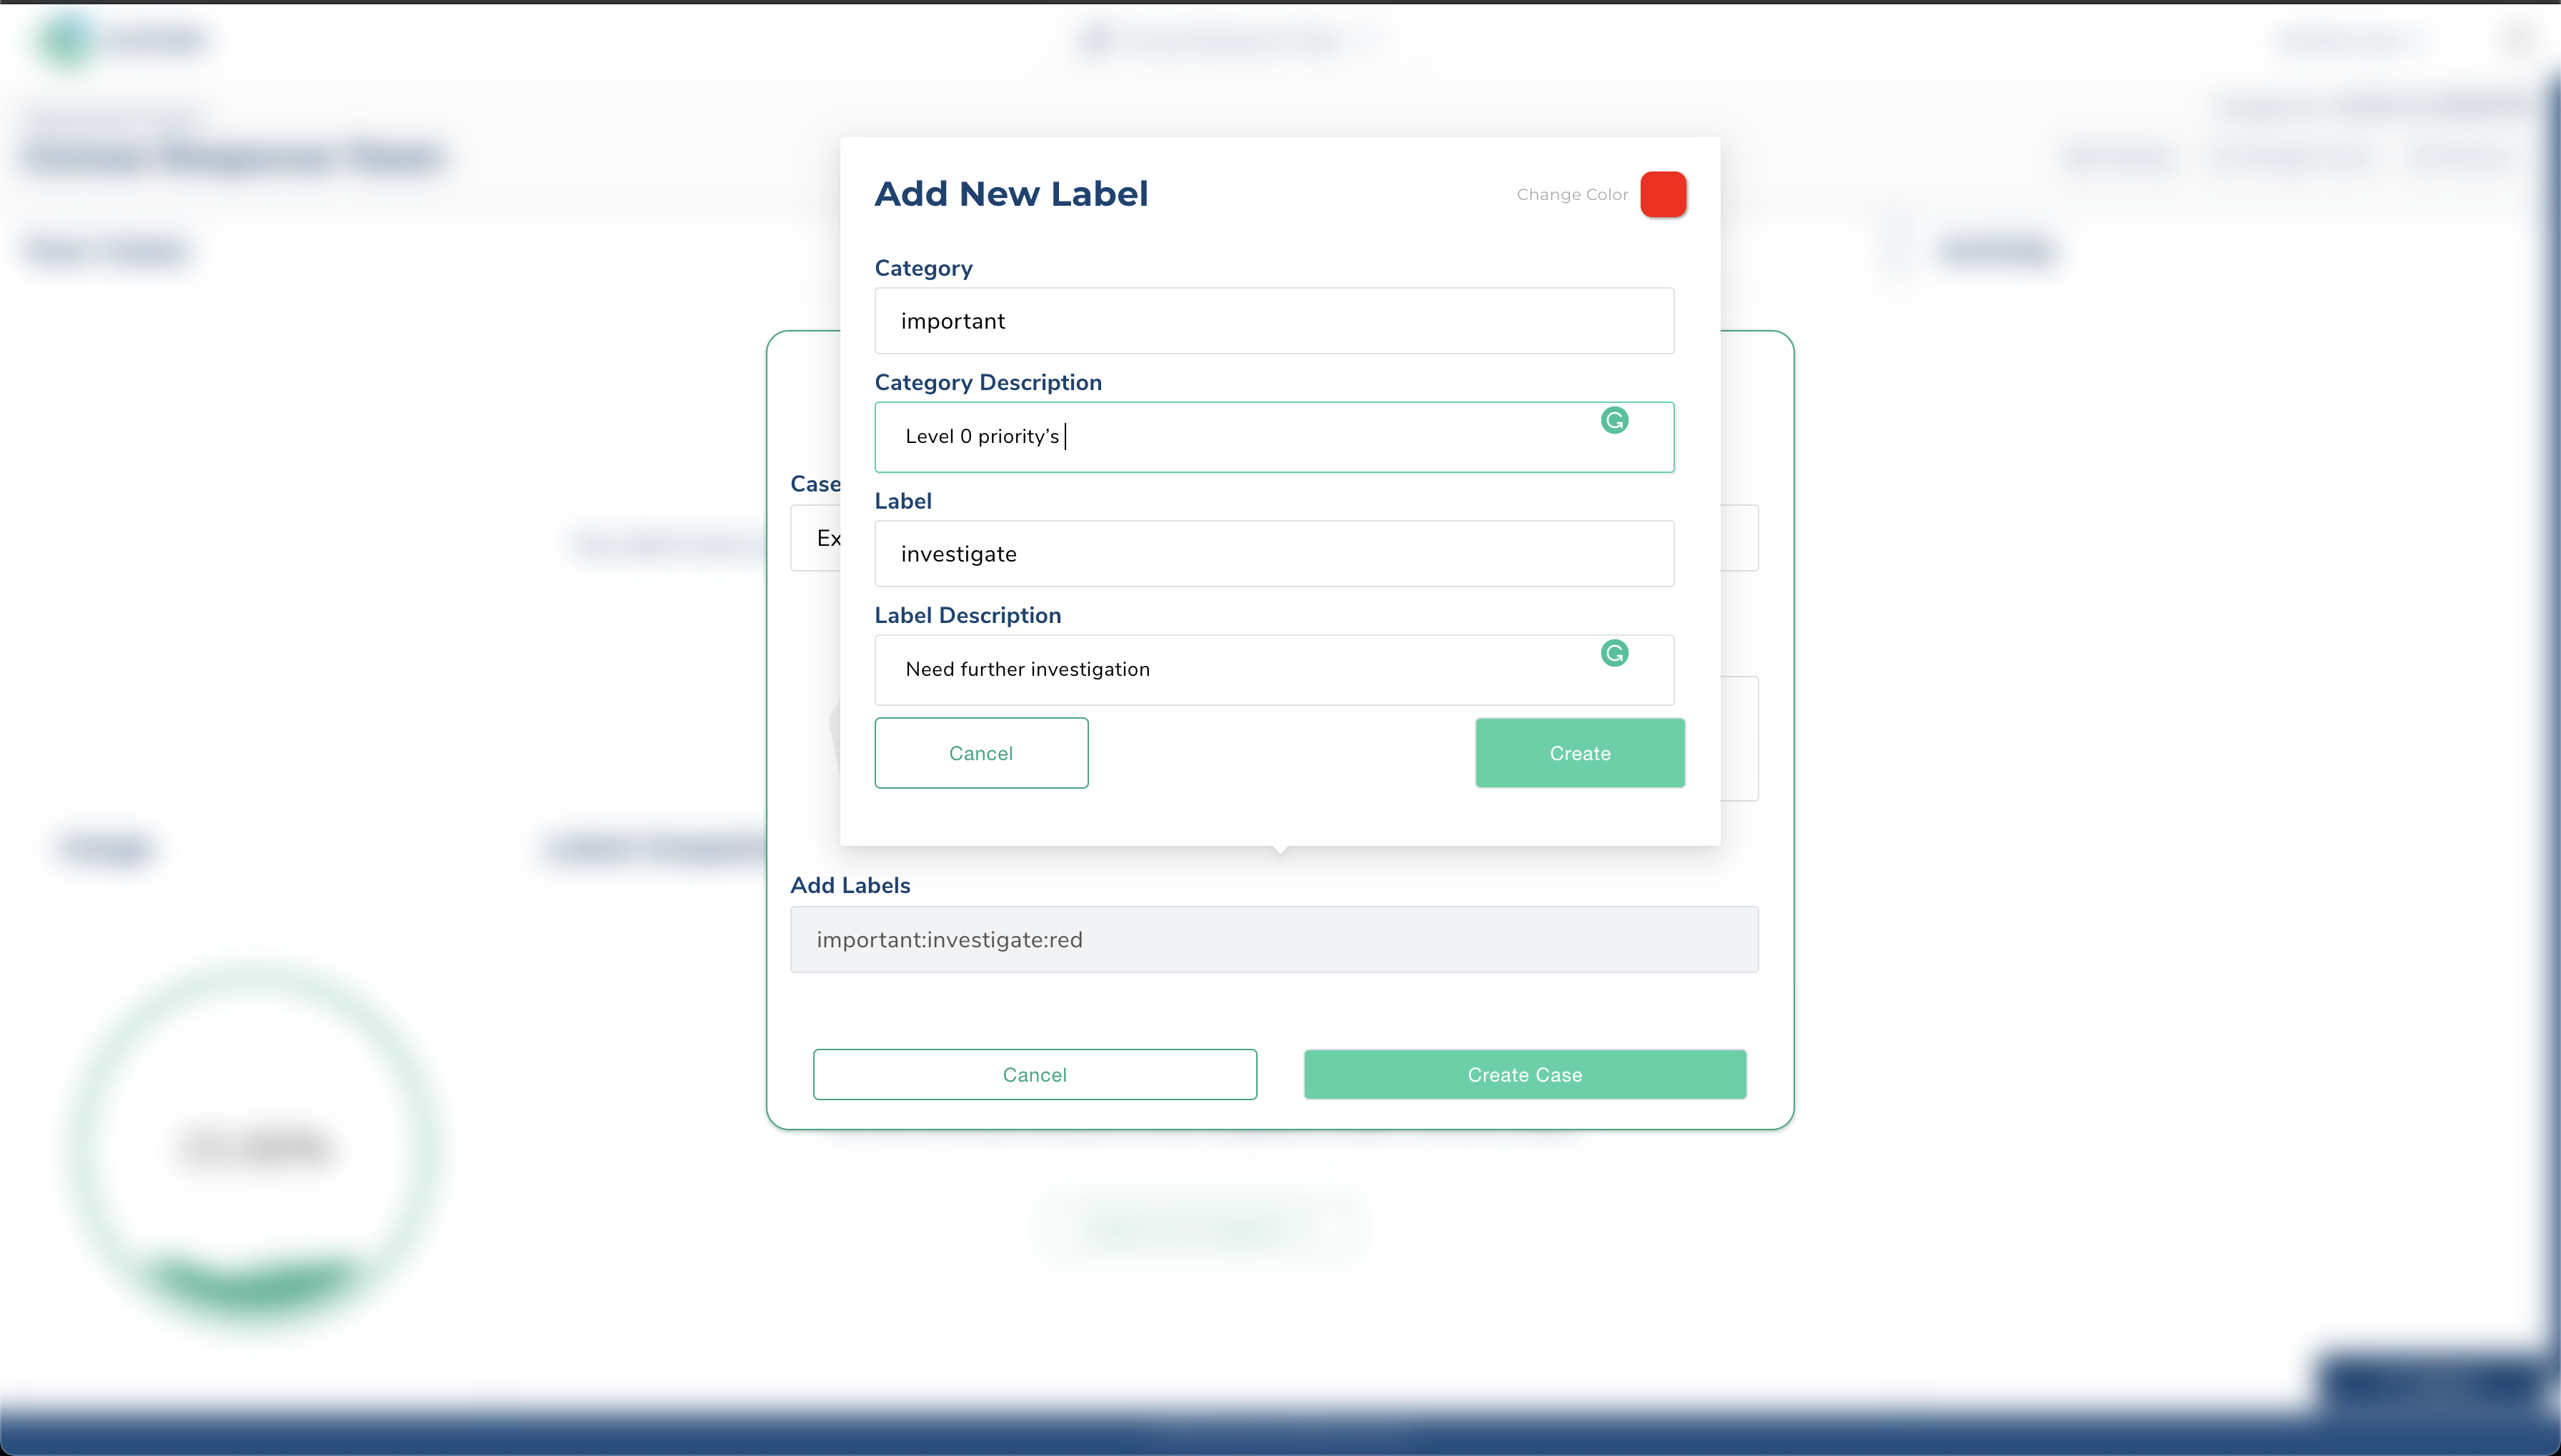
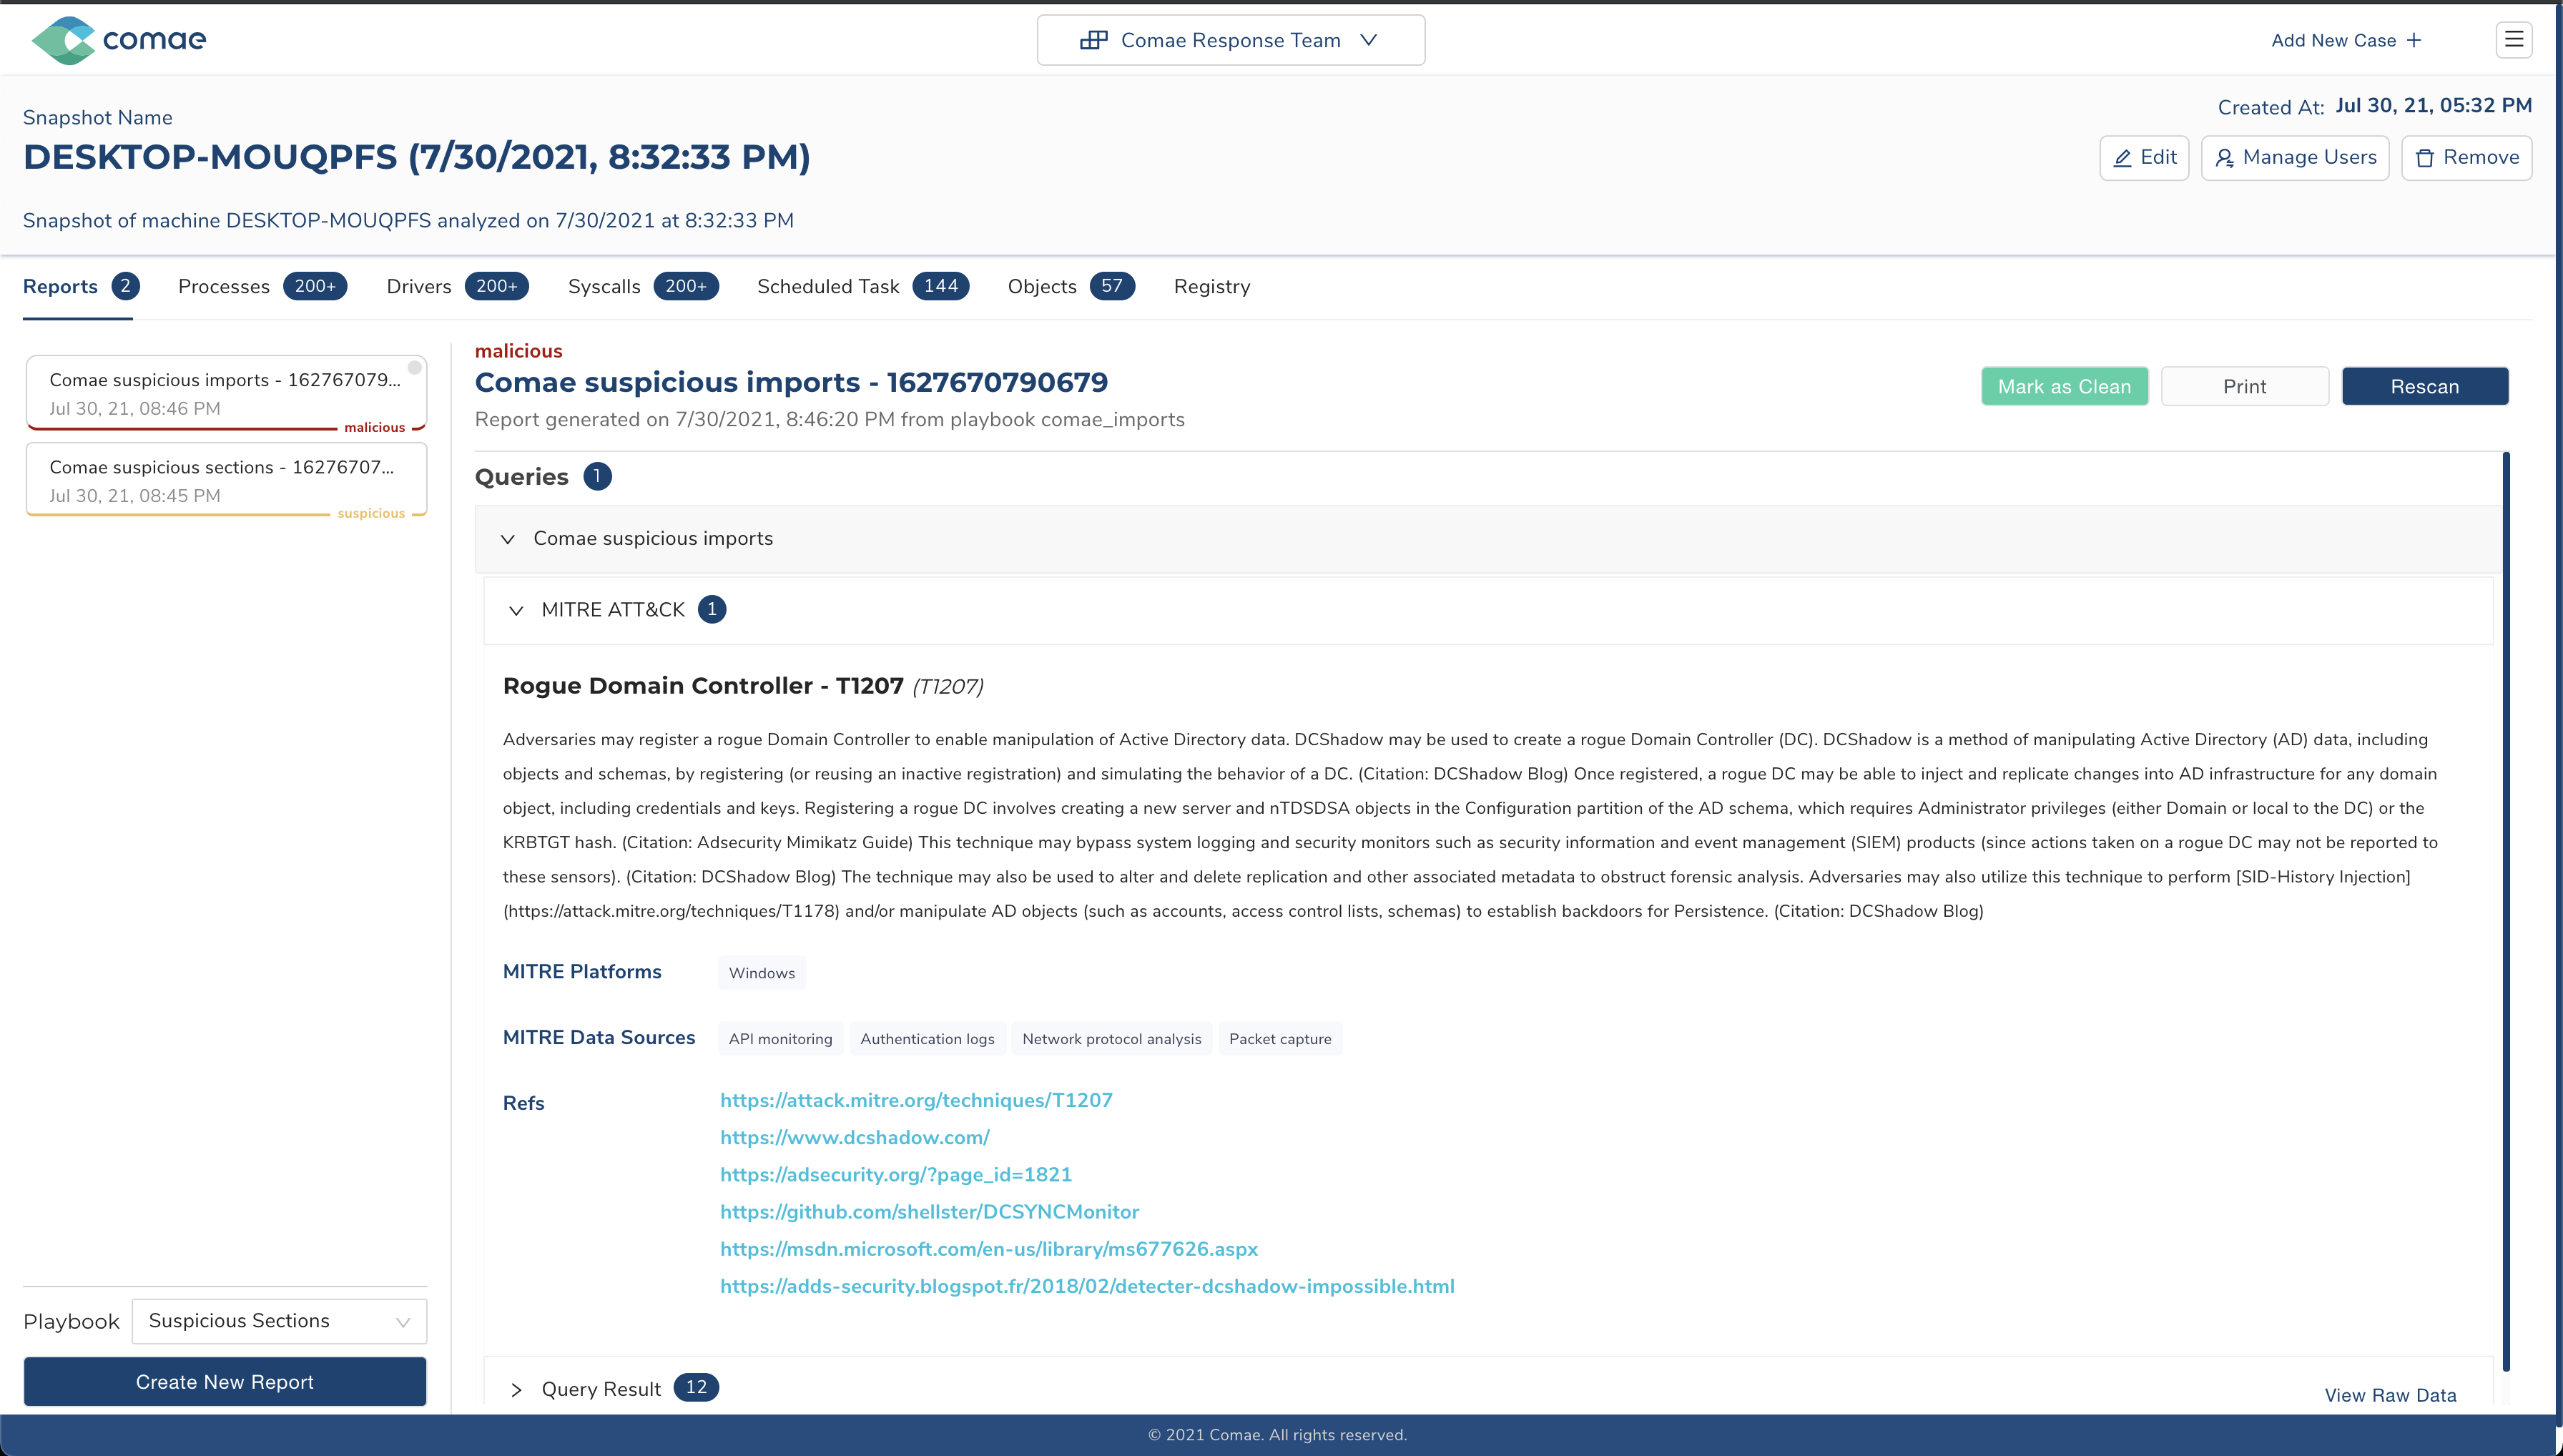
With these queries, users can build (and share) playbooks to look for malicious activity. The playbooks and the platform support MITRE ATT&CK labels, which makes it easier to navigate and classify them.
 We also have a command-line interpreter that can evaluate these queries, so you
can interactively explore memory. It works on both Linux and Windows dumps.
The implementation doesn’t rely on any system APIs, which means you can run this
utility on any OS.
We also have a command-line interpreter that can evaluate these queries, so you
can interactively explore memory. It works on both Linux and Windows dumps.
The implementation doesn’t rely on any system APIs, which means you can run this
utility on any OS.
Conclusion
If your organization is interested in trying out the new Comae memory analysis platform, you can now sign up for our closed beta here.
You can also reach us directly at beta@comae.com if you have questions or if you want to meet up with our CEO Matt Suiche at BlackHat USA 2021.